Analyze
Performance
Version 1.0 · Last updated 2026-06-25
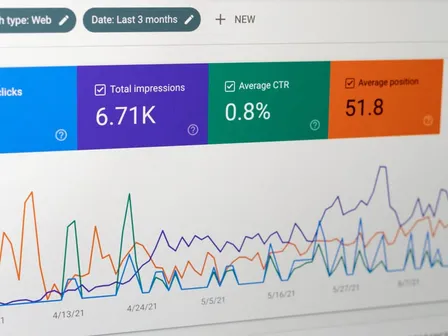
Performance shows you what the agent is doing, in near real-time, across every Moment and surface. This is the dashboard you open every Monday morning, not once a quarter for the board deck.
Key concepts
Conversation counts
Total conversations, broken down by Moment, surface, and Audience. Date range filters.
Resolution and deflection
Two metrics that get conflated often. Deflection is conversations the agent ended without escalation. Resolution is conversations where the customer’s question was actually answered. Resolution is the harder, more useful number.
Feedback
Thumbs up, thumbs down, escalations. Surfaces customer reactions in aggregate.
Top questions
The questions customers asked most often, ranked by volume. Direct input into your Knowledge base priorities.
Top Sources
The Sources the agent referenced most. Direct input into Source quality work.
Platform benchmarks
The numbers Unless customers see across the platform: 78% ticket deflection, 71% efficiency gain, 64% of content operations automated, 37% of requests resolved outside office hours. First-year ROI lands around 512%. Useful as a reality check on your own Performance numbers.
What you can do here
- Track conversation volume across Moments and surfaces
- Compare resolution and deflection rates over time
- Find the top customer questions, ranked by volume
- Spot Sources that are pulling the most weight
- Click into any metric to see contributing conversations
When to use it
- Weekly health check on a stable agent
- Daily check during the first weeks of a pilot
- Diagnosing a sudden drop in resolution or satisfaction
- Identifying which questions deserve new content this sprint
How it works
The Engine aggregates conversation data continuously. Performance reflects the last 24 hours within a few minutes of actual activity. Longer ranges (week, month) take into account every conversation in that window.